The biggest news is still Friday’s downgrade of American debt by Moody’s, and the unprecedented market reaction to it. The last two times that American debt was downgraded, the market reaction left no doubt that the position of the United States at the center of the world economy was unchanged. This time, however, as has been the case with other responses to the Trump administration’s policies, there seems to be a much more serious reaction. Capital is flowing out of the country in a way that it has not in living memory, and unlike previous downgrades, the flight to safety this downgrade has caused is not increasing demand for American assets.
In other news, the Conference Board’s index of leading economic indicators fell again in April, as it has in each month of the second Trump administration.
Unprecedented Downgrade
May 2025: Moody’s Downgraded American Debt From Aaa To Aa1. [Moodys, 2025-05-16]
Moodys Cited $4 Trillion In Revenue Cuts Under Base Case In Downgrade. According to Moodys, “Over more than a decade, US federal debt has risen sharply due to continuous fiscal deficits. During that time, federal spending has increased while tax cuts have reduced government revenues. As deficits and debt have grown, and interest rates have risen, interest payments on government debt have increased markedly. Without adjustments to taxation and spending, we expect budget flexibility to remain limited, with mandatory spending, including interest expense, projected to rise to around 78% of total spending by 2035 from about 73% in 2024. If the 2017 Tax Cuts and Jobs Act is extended, which is our base case, it will add around $4 trillion to the federal fiscal primary (excluding interest payments) deficit over the next decade.” [Moodys, 2025-05-16]
By Itself, The Moody’s Downgrade Is Not Unprecedented…
August 2011: Standard And Poors Downgraded American Debt From AAA To AA+, Citing Skepticism Over Plans For Fiscal Consolidation. [Standard and Poors Global, 2011-08-05]
August 2023: Fitch Downgraded American Debt From AAA To AA+, Citing High Debt Levels And A Declining Democracy. [Fitch Ratings, 2023-08-01]
…But, This Is The First One To Lead To Notable Capital Flight
Code
# Call the custom plot theme that I madeinclude("../scripts/oxocarbon-plot.jl")theme(:oxocarbon)# Set up a connection to the Fred API usingFredData, DataFrames, Dateskey =ENV["FRED_API_KEY"]f =Fred(key)# Get 10 Year Treasury Yield and Dollar Strength Datatnx=get_data(f, "DGS10"; observation_start="2011-08-05", observation_end="2011-08-12").datausd=get_data(f, "DTWEXBGS"; observation_start="2011-08-05", observation_end="2011-08-12").data# Make Plotstreasury_plot=plot(tnx.date, tnx.value; xlabel="Date", ylabel="10 Year Treasury Yield", legend=false, linewidth=2)hline!([tnx.value[1]]; label="Pre-Downgrade", linestyle=:dash)dollar_plot=plot(usd.date, usd.value; xlabel="Date", ylabel="Nominal Broad US Dollar Index", legend=false, linewidth=2)hline!([usd.value[1]]; label="Pre-Downgrade", linestyle=:dash)# Display both Plots Togetherplot(treasury_plot, dollar_plot; layout=(2,1), size=(800,600), title="August 2011: S&P Downgrade")
┌ Warning: Metadata 'notes' not returned from server.
└ @ FredData ~/.julia/packages/FredData/5M7x4/src/get_data.jl:77
After S&P downgraded American debt in 2011, capital flowed into the country due to what is called the dollar smile. The idea behind that is that the dollar is a safe haven asset, so when things are bad anywhere of significance in the world economy, people will move their money to the United States. At the same time, when things are very strong for the country, foreign investors want to put their money to work here. It is only when things are medium, that people will look to opportunities outside of the country to deploy their capital.
Code
# Get 10 Year Treasury Yield and Dollar Strength Datatnx=get_data(f, "DGS10"; observation_start="2023-08-01", observation_end="2023-08-04").datausd=get_data(f, "DTWEXBGS"; observation_start="2023-08-01", observation_end="2023-08-04").data# Make Plotstreasury_plot=plot(tnx.date, tnx.value; xlabel="Date", ylabel="10 Year Treasury Yield", legend=false, linewidth=2)hline!([tnx.value[1]]; label="Pre-Downgrade", linestyle=:dash)dollar_plot=plot(usd.date, usd.value; xlabel="Date", ylabel="Nominal Broad US Dollar Index", legend=false, linewidth=2)hline!([usd.value[1]]; label="Pre-Downgrade", linestyle=:dash)# Display both Plots Togetherplot(treasury_plot, dollar_plot; layout=(2,1), size=(800,600), title="August 2023: Fitch Downgrade")
┌ Warning: Metadata 'notes' not returned from server.
└ @ FredData ~/.julia/packages/FredData/5M7x4/src/get_data.jl:77
In 2023, things were not quite the same, but they were similar. While treasury yields spiked, the dollar spiked with them. That meant that while investors were selling treasury securities, the resulting higher yields were attracting capital. That is natural, and showed that there was no significant movement of capital out of the country.
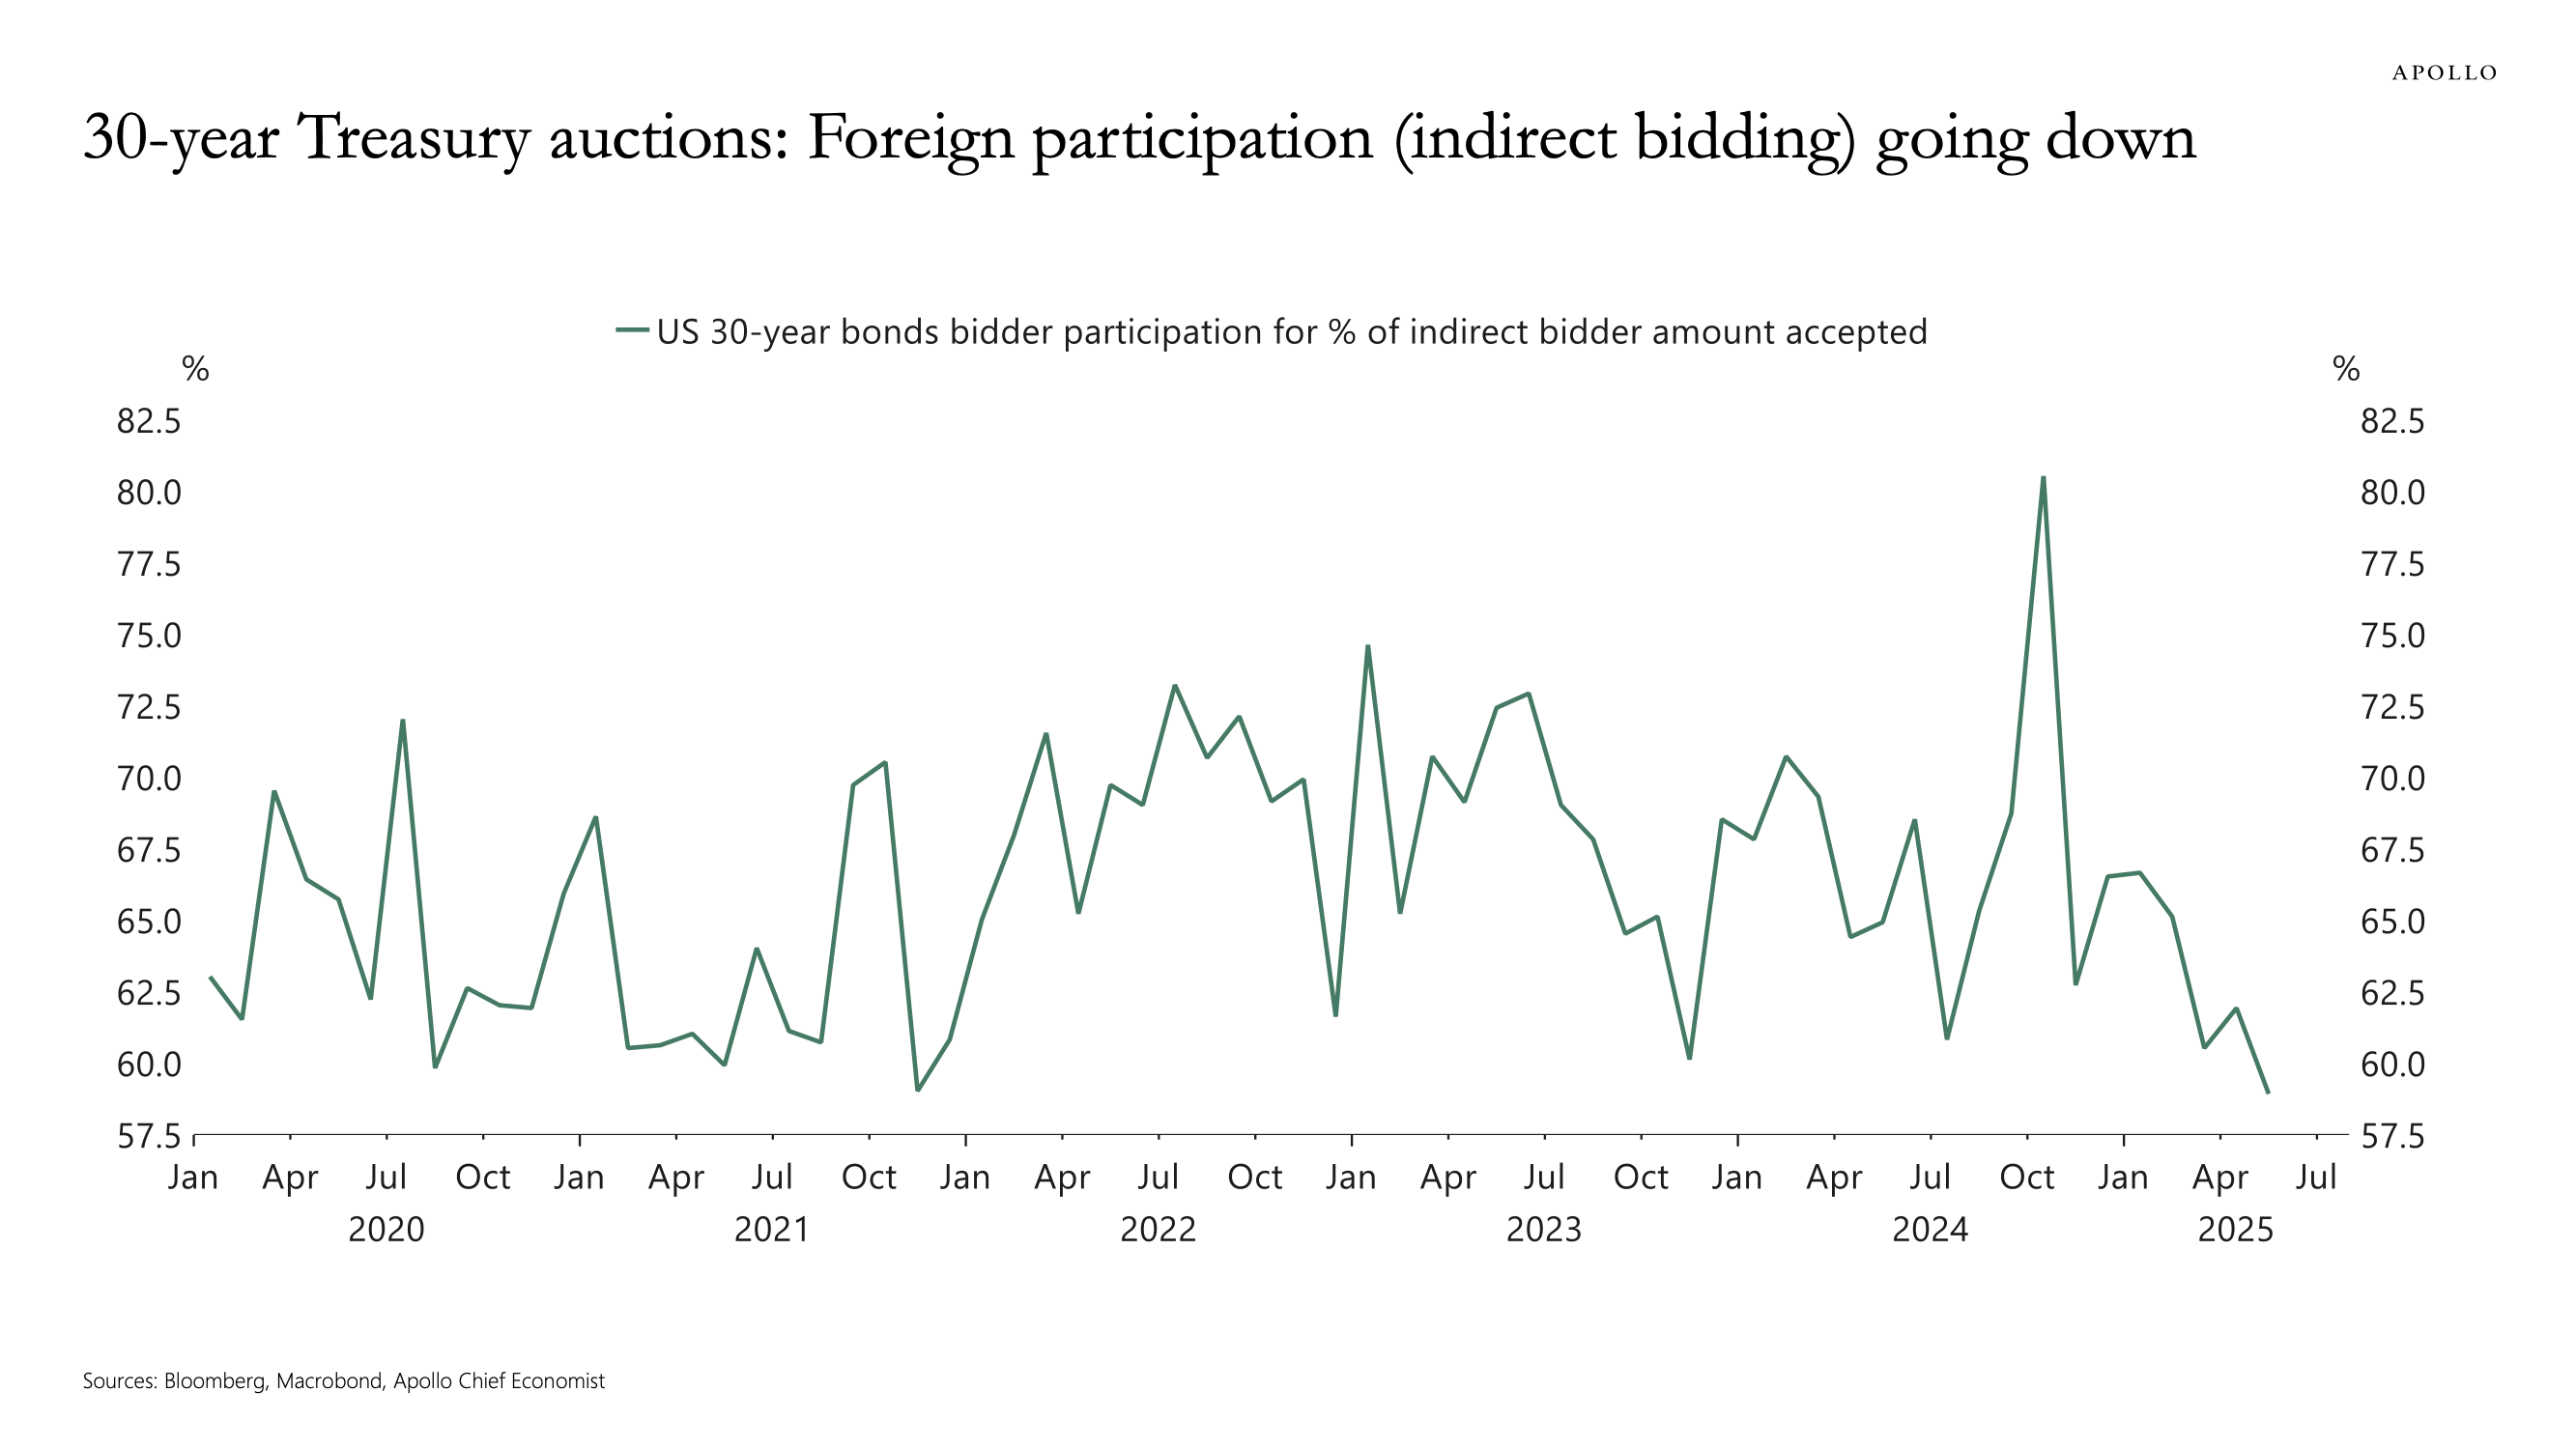
This time may be different. As I write this, the leading Bloomberg headline is Treasuries, Dollar Fall as Moody’s Sharpens Focus on US Debt.link. While there is not enough data yet to show anything conclusively, the early read is another warning sign in the capital flight that has been a features of Trump’s second administration. Foreign participation in long-dated treasury actions, a noisy but important data point, is not encouraging.
2025: Foreign Participation In Long-Dated Treasury Auctions Fell To A Mutli-Year Low. According to Apollo Chief Economist Torsten Slok, [Apollo Chief Economist Torsten Slok, 2025-05-19]
Advanced Economic Indicators
April 2025: Even As March’s Data Was Revised Downward, The Conference Board’s Index Of Leading Economic Indicators Fell Sharply, As “Consumers’ Expectations Have Become Continuously More Pessimistic each Month Since January 2025.” According to the Conference Board, “The Conference Board Leading Economic Index® (LEI) for the US fell sharply by 1.0% in April 2025 to 99.4 (2016=100), after declining by 0.8% in March (revised downward from the –0.7% originally reported). The LEI declined by 2.0% in the six-month period ending April 2025, the same rate of decline as over the previous six months (April–October 2024). ‘The U.S. LEI registered its largest monthly decline since March 2023, when many feared the US was headed into recession, which did not ultimately materialize,’ said Justyna Zabinska-La Monica, Senior Manager, Business Cycle Indicators, at The Conference Board. ’Most components of the index deteriorated. Notably, consumers” expectations have become continuously more pessimistic each month since January 2025, while the contribution of building permits and average working hours in manufacturing turned negative in April.” [Conference Board, 2025-05-19]
 [Apollo Chief Economist Torsten Slok,
 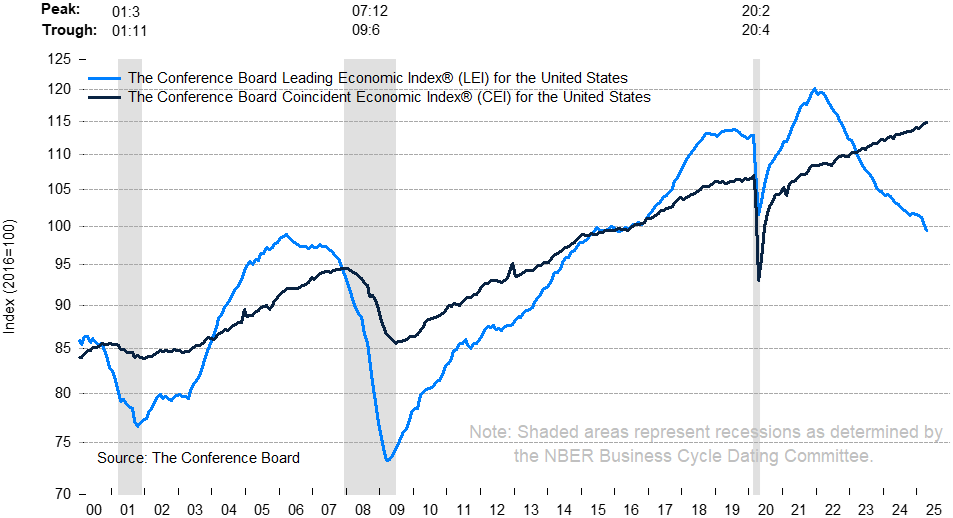 [Conference Board,