Hard and soft data seems to indicate policy-induced economic fragility leading to immediate kitchen-table impacts and longer-term systemic risks. The labor market is showing some classic signs of deterioration—fewer job openings, declining quits (workers feeling less confident about finding better jobs), and rising layoffs—while manufacturing orders have “collapsed,” particularly in the cyclically sensitive durable goods sector that typically signals broader economic distress. Most concretely, Trump’s trade war is already hitting consumers directly: Walmart and Target workers are documenting dramatic price increases. This represents the regressive taxation that tariffs actually constitute—a policy that disproportionately burdens working families while creating the very inflation Republicans claimed to oppose.
Perhaps more concerning for longer-term economic stability is the unprecedented breakdown in financial market functioning that suggests America’s institutional credibility is eroding under Trump’s volatile policymaking. The traditional correlation between rising bond yields and dollar strength has shattered, with yields climbing while the dollar weakens—a pattern historically associated with emerging market crises rather than stable economies. Financial analysts are explicitly citing concerns about “institutional integrity” and Federal Reserve independence, while the administration’s own efficiency efforts have paradoxically made government less efficient, creating backlogs at Social Security and other critical services. Meanwhile, a brewing crisis in private credit markets—where insurers are shopping for inflated ratings on risky loans to game capital requirements—suggests the financial system is again prioritizing short-term profits over prudent risk management. This constellation of economic warning signs provides a compelling narrative about how Trump’s combination of trade wars, institutional attacks, and regulatory capture is simultaneously hurting working families today while building systemic risks for tomorrow.
Releases
Employment
Code
# Load custom plot themeinclude("../scripts/oxocarbon-plot.jl")theme(:oxocarbon)# Load Necessary PackagesusingFredData, DataFrames, Dates, StatsPlots# Connect to the APIkey =ENV["FRED_API_KEY"]f=Fred(key)# Load the dataseries = ["JTSJOL", "JTS1000QUR", "JTS1000LDL"]data = [get_data(f, s; observation_start="2022-04-01", observation_end="2025-05-01", units="pc1").data for s in series]# Make the plotgroupedbar(data[1].date, [data[1].value data[2].value data[3].value]; label=["Openings""Private Quits""Private Layoffs"], xlabel="Date", ylabel="Percent Change, YoY", title="April 2025: Labor Market Tightening", linewidth=2, xrotation=45, bottom_margin=5Plots.mm, )hline!([0.0], color=:black, linestyle=:dash, label="")vline!([Date(2025, 1, 1)], linestyle=:dash, linewidth=2, label="Inauguration")
┌ Warning: Metadata 'notes' not returned from server.
└ @ FredData ~/.julia/packages/FredData/5M7x4/src/get_data.jl:77┌ Warning: Metadata 'notes' not returned from server.
└ @ FredData ~/.julia/packages/FredData/5M7x4/src/get_data.jl:77
NOTE: While the decline in labor market attributes associated with strength (openings and quits) was not out of line with where it has been, the persistence of the trend (more layoffs, fewer quits) implies the labor market became even more static.
Manufacturing Orders
Code
# Gather the dataseries = ["DGORDER", "AMTMNO", "AMNMNO", "ACOGNO", "ACDGNO"]data = [get_data(f, s; observation_start="2024-04-01", observation_end="2025-05-01", units="pch").data for s in series]# Make the plotgroupedbar(data[1].date, [data[1].value data[2].value data[3].value data[4].value data[5].value]; label=["Durable""Total Manufacturing""Nondurable""Consumer""Consumer Durable"], xlabel="Date", ylabel="Percent Change, MoM", title="April 2025: Manufacturing Orders Collapsed", xrotation=45, bottom_margin=5Plots.mm, )
┌ Warning: Metadata 'notes' not returned from server.
└ @ FredData ~/.julia/packages/FredData/5M7x4/src/get_data.jl:77
NOTE: The fact that the decline was (from largest to smallest) in durable goods, overal manufacturing goods, consumer durable goods, and non durable goods is not a good sign. In order, those are the most cyclical of the series presented.
Abortion
AEA Paper: Legalized Abortion Was Associated With Better Lifetime Survival Probabilities. According to Farin in AEA Papers and Proceedings, “Cohorts conceived in states with legalized abortion exhibit better life cycle health. However, the magnitude of improvement in the likelihood of survival of these cohorts varies depending on the age or specification considered. The findings suggest that cohorts conceived under the legal abortion regime have improved survival in the first decades of their lives, and improvement in early childhood health persists well into adulthood in the fifth decade of life. With recent legal developments and shifts in abortion access, induced by the US Supreme Court ruling in Dobbs v. Jackson Women’s Health Organization, understanding the multifaceted impacts of abortion policies on population health is more crucial than ever. By offering insights into the far-reaching consequences of abortion legalization, this paper contributes significantly to the ongoing discourse surrounding reproductive healthcare access and its implications” [Farin in AEA Papers and Proceedings, 2025-05]
NOTE: This paper measured conditional probabilities, meaning the likelihood of surviving to age 20 after surviving to age 20, rather than the likelihood of surviving to age 20 from birth.
Trade War
Higher Prices
Headline: Walmart And Target Workers Are Sharing Pics Of Price Increases Amid Trump’s Trade War. [Independent, 2025-06-03]
One Worker Noted “Fucking Crazy” Price Hikes For Toys. According to the Independent, “Workers at Walmart and Target have been sharing evidence of price hikes that they believe to be caused by Donald Trump’s tariffs. Since announcing his ‘Liberation Day’ import taxes at the start of April, Trump has repeatedly raged at companies not to raise their prices — including Walmart, Ford, and Mattel. ‘Walmart should STOP trying to blame Tariffs as the reason for raising prices,’ he posted last month. ‘Between Walmart and China they should, as is said, “EAT THE TARIFFS,” and not charge valued customers ANYTHING. I’ll be watching, and so will your customers!’ But on Reddit boards dedicated to the two U.S. retail giants, eagle-eyed workers have also been tracking the situation. ‘I work in Toys and we had about 600 price changes in the last couple days… EVERYTHING went up,’ one user posted last week. ’Most things went up $4, but the bigger toys like RCs and hover boards jumped a whole $40-50. It’s f***ing crazy.’” [Independent, 2025-06-03]
Trump’s Last Trade War
Trump’s Last Trade War Saw Drastic Costs Borne By Americans In The Electrical Equipment And Plastics Sectors. According to Deme and Mahmoud in Applied Economics, “In the electrical equipment sector, the welfare loss was estimated at $5.90 billion in 2018, $5.73 billion in 2019, and $5.53 billion in 2020. The 95% confidence interval for these losses ranged from $4.40 to $7.35 billion in 2018, $4.44 to $6.98 billion in 2019, and $4.27 to $6.75 billion in 2020. In the plastics sector, the welfare loss was estimated at $1.24 billion, $1.23 billion, and $1.28 billion for 2018, 2019, and 2020, respectively. The 95% confidence interval estimates for these losses ranged from $0.69 to $1.77 billion in 2018, $0.71 to $1.75 billion in 2019, and $0.74 to $1.80 billion in 2020. On a per capita basis, the average estimated welfare loss for the 2018–2020 period was $17.40 for the electrical equipment sector, with a confidence interval ranging from $13.29 to $21.37. For the plastics sector, the average estimated per capita welfare loss was $3.79, with a confidence interval ranging from $2.18 to $5.40.” [Deme and Mahmoud in Applied Economics, 2024-04-10]
Impact
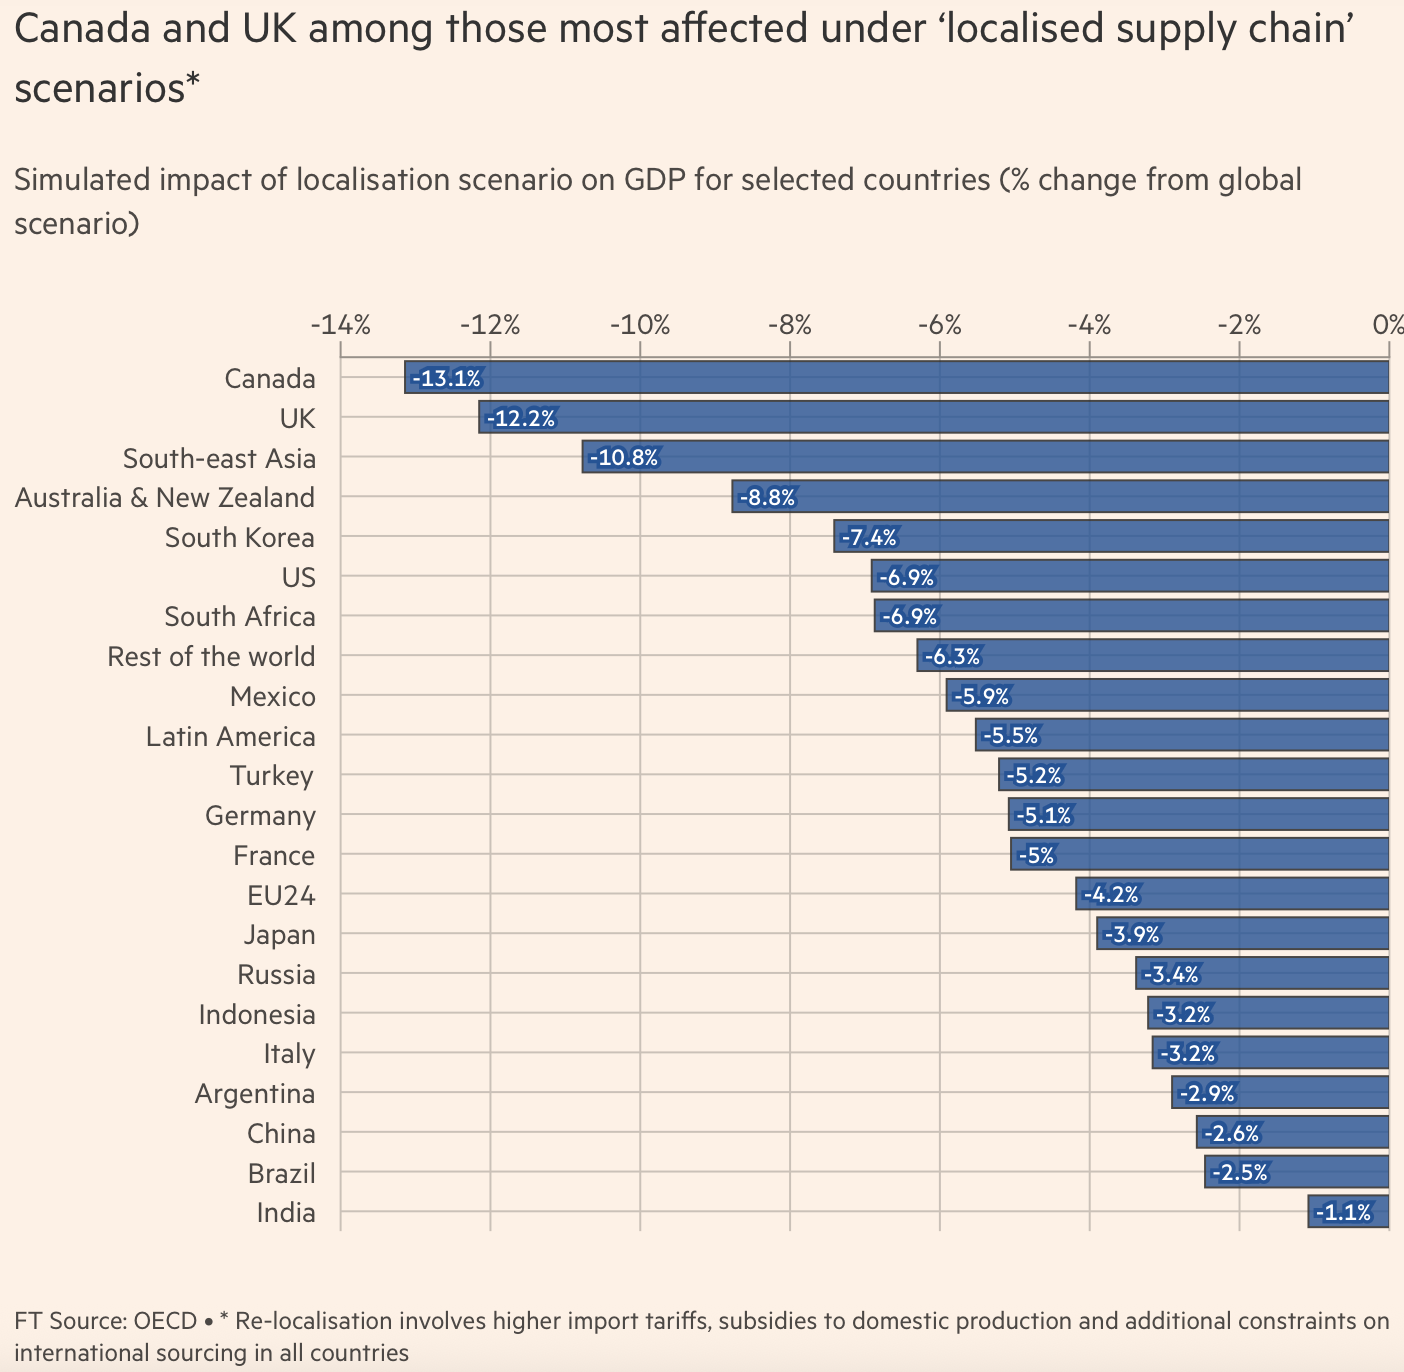
OECD: United States Could Lose Almost Seven Percent Of Future Income Growth If Reshoring In Response To Trump’s Tariffs Is Too Rapid. [Financial Times, 2025-06-02]
Things Breaking
Bloomberg NEF: American Oil Drillers Have Cut Spending Plans By About 3.5 Percent Amid Trump’s Trade War And OPEC+’s Production Surge. According to the New York Times, “U.S. oil companies are pulling back as lower commodity prices take a toll. After two months of crude oil prices hovering around $60 a barrel, companies are shutting down drilling rigs and laying off workers as they pare spending. It now appears very likely that U.S. oil production will not grow much this year, if at all. There are two main reasons for low oil prices. President Trump’s trade war is likely to slow the global economy, hurting demand for fuel. And OPEC Plus, an oil cartel led by Saudi Arabia, is increasing production of oil as demand is softening. On Saturday, eight members of the cartel are widely expected to announce plans to bring even more oil to market this summer, which could send prices lower still. American oil companies are not waiting to find out. While Exxon Mobil and Chevron are maintaining their spending plans, smaller companies are pulling back. Those focused on drilling for oil now plan to spend around 3.5 percent less this year than previously planned, according to a BloombergNEF analysis of a dozen publicly traded companies. All things equal, more drilling tends to drive oil prices down and less drilling generally props them up. ‘We can’t run our program on hope,’ Tom Jorden, chief executive of the oil and gas producer Coterra Energy, told analysts during an earnings call this month. ‘So we are battening down the hatches, expecting this to last for a while.’” [New York Times, 2025-05-30]
IEA: At Oil Prices Around $60 Per Barrel, American Shale Rigs Could Be Pulled. According to the New York Times, “The pullback means that production in U.S. shale basins, which generate most of the country’s oil, is likely to start declining later this year, according to the International Energy Agency, a Paris-based organization of industrialized countries including the United States. The contraction could be swift if oil falls under $60 a barrel and remains there. For every dollar below that threshold, the I.E.A. estimates, five drilling rigs could be pulled out of U.S. fields. When companies drop rigs, workers often lose their jobs, hurting the economy of states like Texas.” [New York Times, 2025-05-30]
Capital Flight
Code
usingYFinance# Get the datatnx =get_prices("^TNX", startdt=Date(2021, 1, 1), enddt=Date(2025, 6, 1), interval="1d") |> DataFramedxy=get_prices("DX-Y.NYB", startdt=Date(2021, 1, 1), enddt=Date(2025, 6, 1), interval="1d") |> DataFrame# Create a two axis plotplot(tnx.timestamp, tnx.adjclose, xlabel="Date", ylabel="10 Year Yield (%)", title="Divergence Between 10 Year Yield and Dollar Index", label="10 Year Yield", linewidth=2)vline!([DateTime(2025,1,20)], linestyle=:dash, linewidth=2, label="Inaguration")right_axis =twinx()plot!(right_axis, dxy.timestamp, dxy.adjclose, ylabel="Dollar Index", label="Dollar Index", linewidth=2, color=colorant"#525252", legend=:bottomright)
The Second Trump Administration’s Attacks On What Has Historically Made The United States An Attractive Place To Invest Has Broken The Typical Correlation Between Bond Yields And Dollar Strength. According to the Financial Times, “The close relationship between US government bond yields and the dollar has broken down as investors cool on American assets in response to President Donald Trump’s volatile policymaking. Government borrowing costs and the value of the currency have tended to move in step with each other in recent years, with higher yields typically signalling a strong economy and attracting inflows of foreign capital. But since Trump’s ‘liberation day’ tariffs were announced in early April, the 10-year yield has risen from 4.16 per cent to 4.42 per cent, while the dollar has dropped 4.7 per cent against a basket of currencies. This month, the correlation between the two has fallen to its lowest level in nearly three years. ‘Under normal circumstances, [higher yields] are a sign of the US economy performing strongly. That’s attractive for capital inflows into the US,’ said Shahab Jalinoos, head of G10 FX strategy at UBS. But ‘if the yields are going up because US debt is more risky, because of fiscal concerns and policy uncertainty, at the same time the dollar can weaken’, he said, a pattern that was ‘more frequently seen in emerging markets’. The president’s ‘big, beautiful’ tax bill, along with the recent Moody’s downgrade of the US’s credit rating, has brought the sustainability of the deficit into sharper focus for investors and weighed on bond prices. Analysis by Torsten Sløk, chief economist at Apollo, suggested that US government credit default swap spreads — which reflect the cost of protecting a loan against default — are trading at levels similar to Greece and Italy. Trump’s attacks on Federal Reserve chair Jay Powell have also spooked the market. The president summoned Powell to the White House this week and told the central banker he was making a mistake in not cutting interest rates. ‘The strength of the US dollar comes partly from its institutional integrity: the rule of law, independence of central banking and policy that’s predictable. These are the components that create the dollar as the reserve currency,’ said Michael de Pass, global head of rates trading at Citadel Securities. ‘The last three months have called that into question,’ he said, adding that ‘a major concern for markets right now is whether we are chipping away at the institutional credibility of the dollar’. The divergence between Treasury yields and the dollar represents a marked shift from the pattern of recent years, when expectations about the direction of monetary policy and economic growth had been crucial drivers of government borrowing costs.” [Financial Times, 2025-06-01]
UBS Economist: If This Pattern Continues, There Could Be Billions Of Dollars In Outflows From The United States. According to the Financial Times, “Investors were questioning whether there had been a fundamental shift in correlations between asset classes, Goldman Sachs analysts wrote in a note on Friday. ‘It is in the newer worries around . . . Fed independence and fiscal sustainability where the asset pattern looks most clearly different,’ they wrote. ‘The recent phenomenon of dollar weakness alongside higher yields and lower equity prices . . . has posed a challenge to both of the common portfolio hedges,’ the Goldman analysts added. The weaker US currency is partly down to holders of dollar-denominated assets increasingly looking to hedge those investments, taking a short position in the dollar in the process. ‘The more policy uncertainty there is, the more likely it is that investors will raise their hedge ratios,’ said UBS’s Jalinoos. ‘If hedge ratios increase on the existing stock of dollar assets, you”re talking about many billions of dollars of selling [US dollar],’ he added. The Goldman analysts suggested that investors should position for dollar weakness, especially against the euro, yen and Swiss franc, all of which have risen in recent months. They added that ‘these new risks create a strong basis for some allocation to gold’.” [Financial Times, 2025-06-01]
June 2025: Wall Street Economists Forecast Continued Dollar Weakening. According to Bloomberg, “Wall Street banks are reinforcing their calls that the dollar will weaken further, hit by interest-rate cuts, slowing economic growth and President Donald Trump’s trade and tax policies. Morgan Stanley said the greenback will tumble to levels last seen during the Covid-19 pandemic by the middle of next year, while JPMorgan Chase & Co. remains bearish on the US currency. Goldman Sachs Group Inc. said Washington’s efforts to explore alternative revenue sources — should tariffs be impeded — may be even more negative for the dollar. “We think a medium-term narrative around a weaker dollar is building,” said Aroop Chatterjee, a strategist at Wells Fargo in New York.” [Bloomberg, 2025-06-02]
2025: Dollar Net Short Positions Approached The Highest Level Since 2023. According to Bloomberg,  generate more money than it costs to run the insurer and pay out benefits. This leads insurers to want very high returns, but, due to the fact that a number of insurers have blown up in ways that were very costly, they are highly regulated. As a result, when they make an investment, they have to set aside money (called capital) to cover potential losses.
Therefore, as they have to set aside more capital for riskier investments, the actual return on those investments is reduced due to the capital. For example, with the 3.2 percent capital charge on a BB+ loan, the actual return on a one year loan with a 10 percent interest rate is 6.6 percent. If the same loan is BBB-, on the other hand, the capital charge is only 2.2 percent, meaning the actual return is 7.6 percent.
That incentive means that insurers are incentivized to find ways to get higher ratings on their loans, even if they are riskier than the rating implies. This becomes a problem when loans go bad, and there is not enough capital to cover the losses. This is where reinsurance comes in, but a big story in recent years has been the growth of less regulated Cayman island reinsurance companies, and there is a worry that, in the event of a substantial downturn, they would not be able to cover those losses. Especially as the reinsurance industry essentially engages in the same basic trade as the insurance industry, and therefore has significant exposure to private credit.
 [Financial Times,
 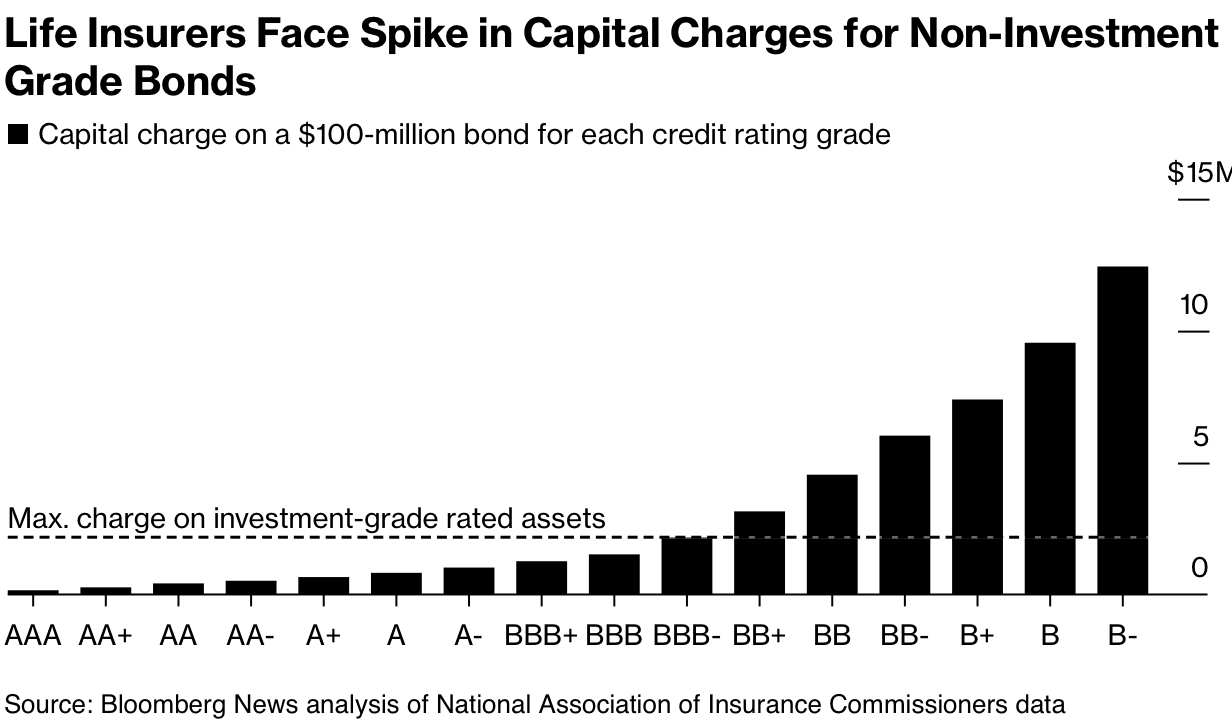 [Bloomberg,