While yesterday’s release of inflation showed only a small increase, diving deeper into the releases showed some more worrying trends. Categories that update less frequently (and therefore have to incorporate future expectations of inflation), rose faster than the overall basket, while the median and trimmed-mean measures also saw dramatic increases. This was matched by the Cleveland Fed’s market-driven measure of inflation expectations, which jumped over the next one and two years.
At the same time, the number of job postings fell, a measure of tightness in nonfinancial leverage got worse, and diminishing stability expectations have meant that the term premium in U.S. Debt has grown. At the same time, the Trump administration’s attack on public goods like weather forecasting have coincided with a surge in insurers trying to mitigate their exposure to extreme weather by selling catastrophe bonds.
If that weren’t enough, major stories came out showing just how much more complicated the Trump regulatory environment has become, with myriad tariff announcements and special carve-outs in his BBB.
Measures of “sticky” inflation track categories that typically change their prices infrequently. The value they give is that firms with limited opportunities can be expected to incorporate expectations about future inflation into their pricing decisions.
Code
trimmed=get_data(f, "TRMMEANCPIM158SFRBCLE"; observation_start="2024-06-01", observation_end="2025-06-02", ).datamedian_cpi=get_data(f, "MEDCPIM158SFRBCLE"; observation_start="2024-06-01", observation_end="2025-06-02", ).data# Make the Plotplot(trimmed.date, trimmed.value; linewidth=2, label="16% Trimmed Mean CPI", xlabel="Month", ylabel="Price Increase %, YoY", title="June 2025: Most Categories Saw Major Price Hikes",)plot!(cpi.date, cpi.value; label="CPI", linewidth=2, linestyle=:dash,)plot!(median_cpi.date, median_cpi.value; linewidth=2, label="Median CPI",)hline!([2.0]; label="Fed Target", linestyle=:dash, linewidth=2)vline!([Date(2025,4,2)]; label="\"Liberation Day\"", linestyle=:dash, linewidth=2, )
The median and trimmed mean measures of CPI work to try to calculate price increases excluding categories that may be outliers. For the trimmed mean, that means taking out the 16 percent of categories seeing the largest price increases and the 16 percent of goods with the smallest prices increases (or largest price declines), and recalculating the index for the 68 percent of categories left. For the median, it is quite simply the median price increase among categories.
Code
ahead1y=get_data(f, "EXPINF1YR"; observation_start="2024-07-01", observation_end="2025-07-02", ).dataahead2y=get_data(f, "EXPINF2YR"; observation_start="2024-07-01", observation_end="2025-07-02", ).data# Make the Plotplot(ahead1y.date, ahead1y.value; linewidth=2, label="1y Ahead", xlabel="Month", ylabel="Expected Inflation Rate", title="Inflation Expectations Surged in July 2025",)plot!(ahead2y.date, ahead2y.value; linewidth=2, label="2y Ahead",)hline!([2.0]; label="Fed Target", linestyle=:dash, linewidth=2)vline!([Date(2025,4,2)]; label="\"Liberation Day\"", linestyle=:dash, linewidth=2, )
The Cleveland Fed constructs a model every month of expected inflation taking into account Treasury Yields, inflation data, inflation swaps, and survey-based measures of inflation expectations.
Job Postings
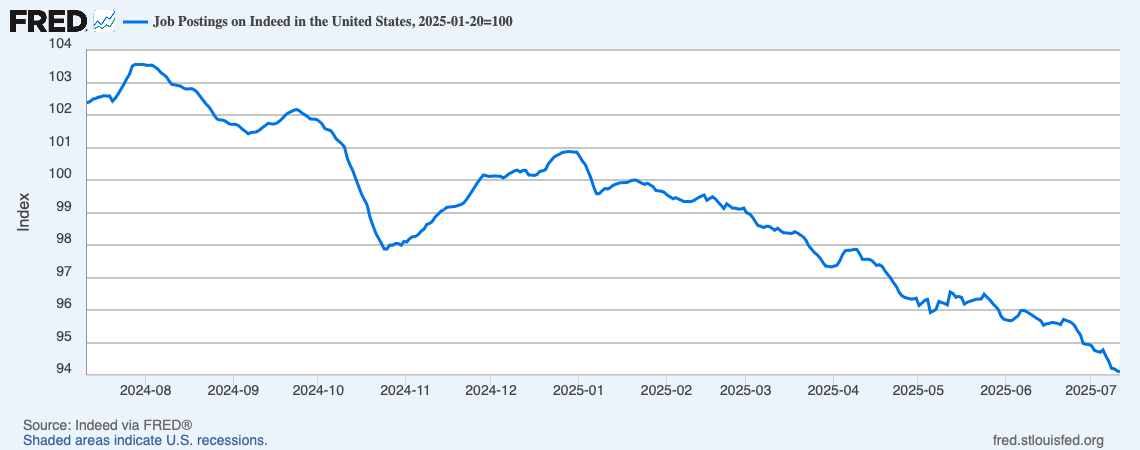
Since Trump’s Inauguration, The Number Of Job Postings On Indeed Has Fallen 5.9 Percent. According to Indeed, “” [Indeed, 2025-07-11]
“The nonfinancial leverage subindex of the NFCI best exemplifies how leverage can serve as an early warning signal for financial stress and its potential impact on economic growth. The positive weight assigned to both the household and nonfinancial business leverage measures in this NFCI subindex make it characteristic of the feedback process between the financial and nonfinancial sectors of the economy often referred to as the “financial accelerator.’ Increasingly tighter financial conditions are associated with rising risk premiums and declining asset values. The net worth of households and nonfinancial firms is, thus, reduced at the same time that credit tightens. This leads to a period of deleveraging (i.e., debt reduction) across the financial and nonfinancial sectors of the economy and ultimately to lower economic activity.’” NOTE: for this index, positive values indicate tighter conditions.
Financial Instability
July 2024 - July 2025: The Term Premium Has Taken Up An Increasingly Large Share Of Ten Year Treasury Has Grown Substantially, Diminishing Market Expectations Of Stability. According to Ernie Tedeschi in Bloomberg, “In other words, long-term rates can be thought of as a built-up layer cake of different expectations from market participants. The first layer is expectations for future real, or inflation-adjusted, federal funds rates set by the Fed. If the market thinks a new Chair will keep policy artificially low in the future, this layer would fall. The problem is that other layers may rise if investors see a politically captive Fed and expect more inflation than before, needing to be compensated with higher yields. Likewise, the term premium — the additional yield investors demand for the risk of holding a long-dated security to maturity — could rise as the uncertainty of a captive Fed raises risks. As The Budget Lab described in a report last year, such a Fed erodes the safe harbor premium and makes domestic investment more expensive. This trade-off appears to be exactly the dynamic happening now. A model of the 10-year Treasury’s term structure suggests that over the past year, while expectations of future average policy rates have fallen by 80 basis points, this has been almost exactly offset by higher term premia.” [Ernie Tedeschi in Bloomberg, 2025-07-16]
Need To Offload Climate Risk
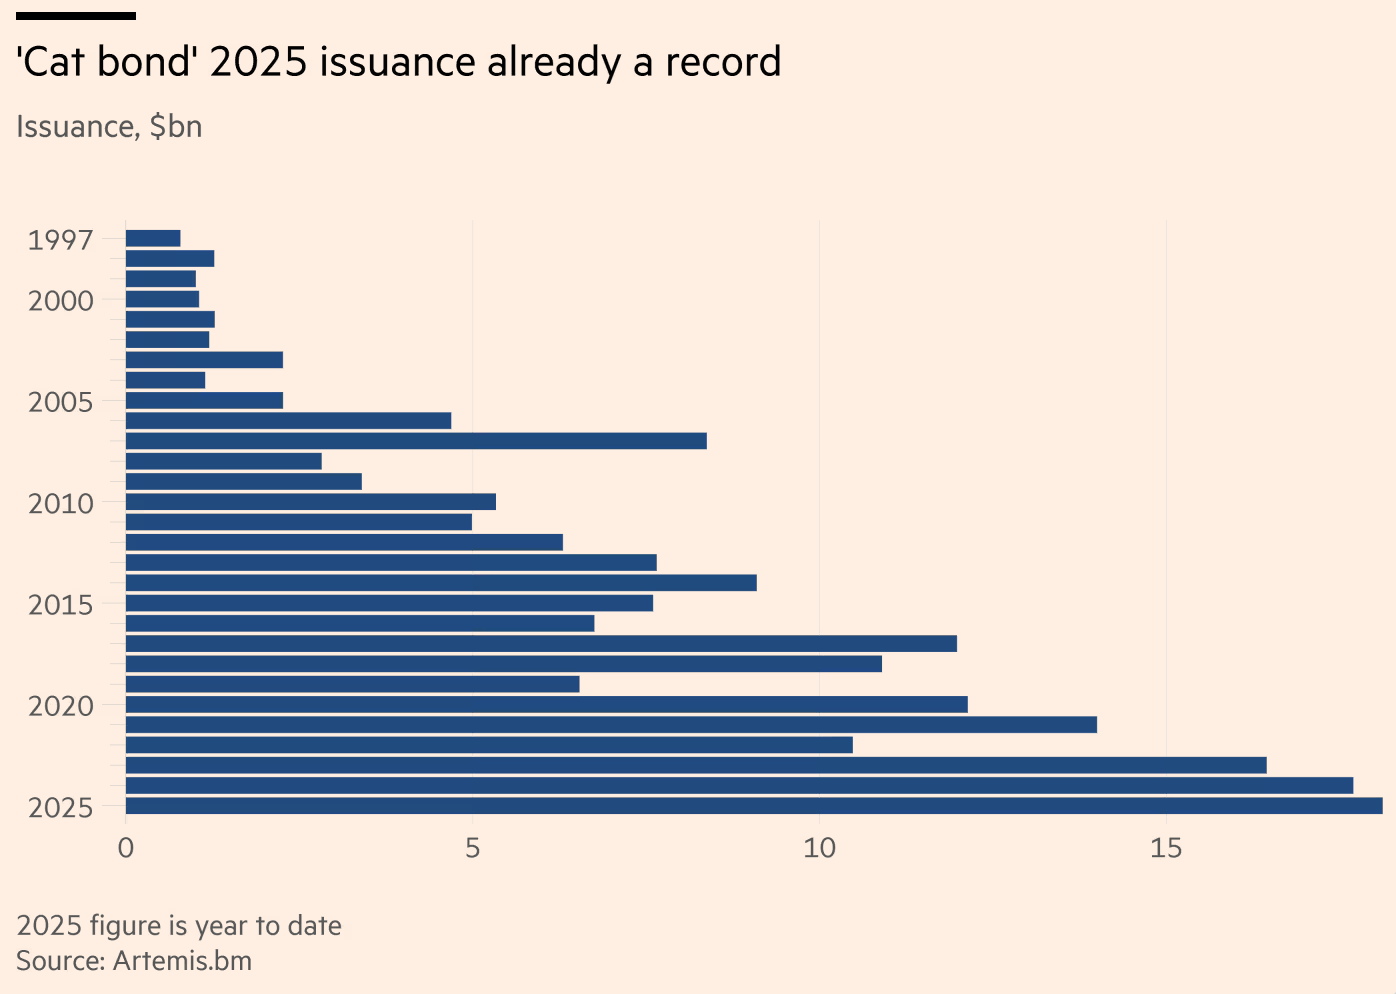
Year-To-Date: Insurers Have Already Issued More Catastrophe Bonds For Reinsurance Than In All Of The Previous Record Year: 2024. [Financial Times, 2025-07-15]
Economic Degradation
Destruction Of Public Goods
Trump’s Proposed Cuts To NOAA Would Close Laboratories Including The Ones That Send Teams To Fly Into Hurricanes To Gather Data. According to the New York Times, “In an effort to shrink the federal government, President Trump and congressional Republicans have taken steps that are diluting the country’s ability to anticipate, prepare for and respond to catastrophic flooding and other extreme weather events, disaster experts say. Staff reductions, budget cuts and other changes made by the administration since January have already created holes at the National Weather Service, which forecasts and warns of dangerous weather. Mr. Trump’s budget proposal for the next fiscal year would close 10 laboratories run by the National Oceanic and Atmospheric Administration that research the ways a warming planet is changing weather, among other things. That work is essential to more accurately predicting life-threatening hazards. Among the shuttered labs would be one in Miami that sends teams of ‘hurricane hunters’ to fly into storms to collect critical data. The proposed budget would also make major cuts to a federal program that uses river gauges to predict floods.” [New York Times, 2025-07-13]
In Addition, Trump’s Proposed Cuts Would Lead To The Closure Of The Lab That Works On Improving The Accuracy Of Flash Flood Forecasts. According to the New York Times, “The president is preparing to deal another blow to weather forecasting in his spending plan for next year, which would cut funding for NOAA by another $2 billion, or 27 percent. On the chopping block would be the agency’s entire scientific research division, one of the world’s premier weather and climate research centers, preventing the creation of new weather forecasting technologies. Ten laboratories across the country are also slated to be closed, including the National Severe Storms Laboratory in Norman, Okla. Founded in 1964, the lab created a tool to improve the accuracy of flash flood forecasts across the country — the same tool that correctly predicted the Guadalupe River’s rise after the floods hit Central Texas.” [New York Times, 2025-07-13]
Intricate, Hard To Follow Regulation
January - July 2025: Trump Made More Than 50 Discrete Tariff Announcements, Making Importers Spend More Time Updating Forms. According to Bloomberg, “President Trump has made more than 50 discrete announcements regarding tariffs since taking office in January—an average of more than two per week. They’ve had Lieberman’s 10-person team working around the clock, updating forms, combing through the constant alerts from US Customs and Border Protection, and contacting customers who might be affected by the changes.” [Bloomberg, 2025-07-15]
Bloomberg: After Trump’s BBB, “The Rates Americans Pay Will Now Depend Less On How Much Money They Make, And More On How They Earn It, Where They Live And Even Who They Are.” According to Bloomberg, “Boil down the hundreds of tax provisions in the sprawling legislation signed by President Donald Trump on July 4, and it becomes clear: The rates Americans pay will now depend less on how much money they make, and more on how they earn it, where they live and even who they are. The new Republican-passed law is a departure from a longtime objective of many conservatives to simplify the tax code. GOP presidential candidates Steve Forbes in the 1990s and Herman Cain in the 2012 campaign famously espoused flat tax systems stripped of deductions, while Republicans” 2017 overhaul during Trump’s first term trimmed back dozens of special provisions, even as it introduced a few new lucrative breaks for business owners and investors. By contrast, the new $3.4 trillion fiscal package multiplies the categories of people and economic activity getting favored treatment. It extends and expands the 2017 law’s benefits for investors, business owners and wealthy heirs, while adding new deductions for tips, overtime, auto loan interest, seniors, parents and various industries.” [Bloomberg, 2025-07-15]
Pass-Through Business Owners In Some, But Not All Sectors, Private Equity Executives, And Venture Capitalists Received Special Benefits. According to Bloomberg, “A lucrative 20% deduction for pass-through business owners, introduced in 2017 and scheduled to expire, will remain in the code while continuing to exclude the wealthy in legal, financial, health care and other service industries. Private equity executives will keep paying lower rates than other financial professionals, through a loophole called carried interest that Trump had vowed to plug. Venture capitalists and startup founders will get to avoid taxes on millions of dollars of extra income, through a more generous version of the qualified small business stock, or QSBS, break.” [Bloomberg, 2025-07-15]
Trump’s BBB Contained Provisions Raising The Size Limit For A “Small Business,” Requiring A Shorter Holding Time For Tax-Free Capital Gains, And Raising The Threshold For Tax-Free Capital Gains By $5 Million. According to the Wall Street Journal, “Tucked into the “big beautiful bill” signed by President Trump is a new incentive for shareholders of venture-backed startups to sell their shares on what is known as the secondary market. Investors don’t expect the change to trigger a stampede of sellers, but they say cashing out earlier is now a bit easier. The new tax-and-spend law expands the Qualified Small Business Stock tax exclusion to allow investors in startups to sell more of their holdings early without paying capital-gains taxes. The new bill raises the per-issuer cap on eligible gains to $15 million, from $10 million, allowing investors to reap the benefits while holding shares for shorter periods. The new provision also increases the maximum asset threshold for a company to qualify as a small business from $50 million to $75 million and introduced a tiered holding period for capital-gains tax exclusion, which could offer shareholders more flexibility for exits before the five-year mark.” [Wall Street Journal, 2025-07-14]
 ” [Indeed,
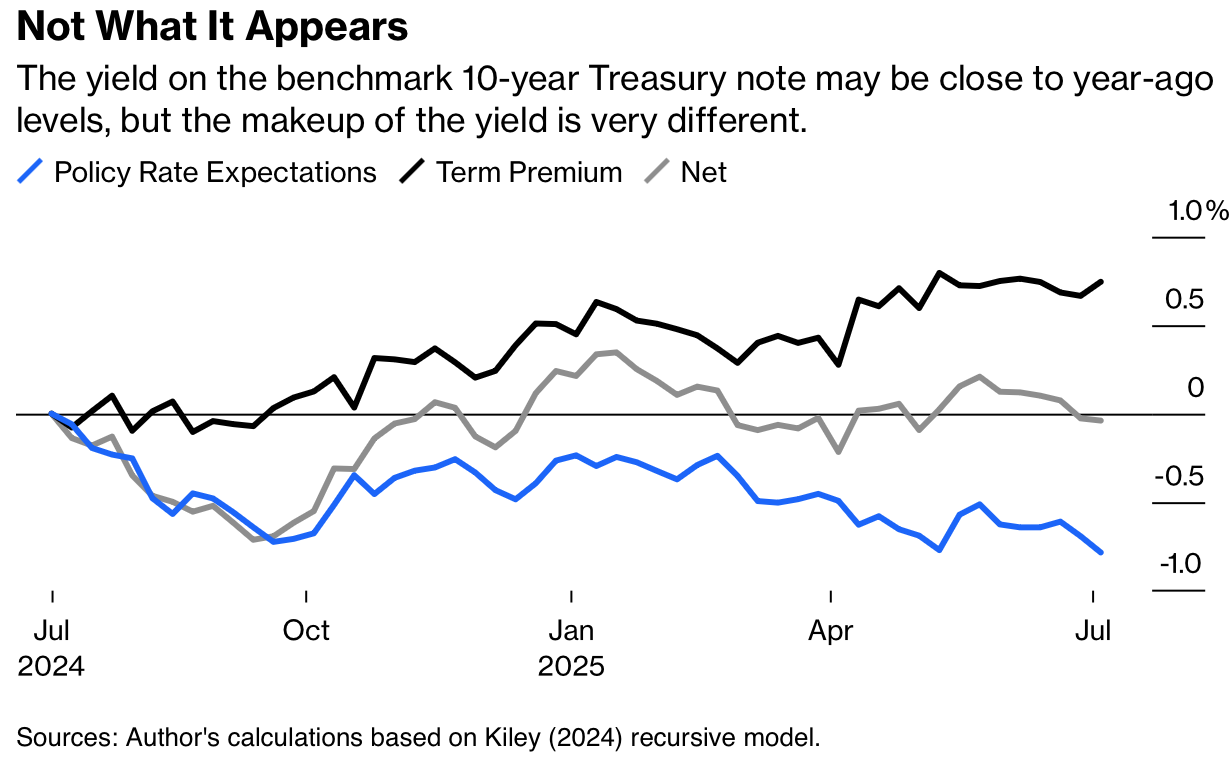
 [Financial Times,