┌ Warning: Metadata 'notes' not returned from server.
└ @ FredData ~/.julia/packages/FredData/5M7x4/src/get_data.jl:77┌ Warning: Metadata 'notes' not returned from server.
└ @ FredData ~/.julia/packages/FredData/5M7x4/src/get_data.jl:77┌ Warning: Metadata 'notes' not returned from server.
└ @ FredData ~/.julia/packages/FredData/5M7x4/src/get_data.jl:77┌ Warning: Metadata 'notes' not returned from server.
└ @ FredData ~/.julia/packages/FredData/5M7x4/src/get_data.jl:77
The Producer Price Index’s stages of intermediate production could be illustrated as follows, with some of the transmission mechanisms described.
flowchart TD
    %% Stage 1 - Furthest from Final Demand
    S1[Stage 1 Intermediate Demand<br/>Raw Materials & Basic Services]
    S1_Examples["• Oil & Gas Extraction<br/>• Paper Mills<br/>• Grain Farming<br/>• Logging<br/>• Real Estate Services<br/>• Legal Services<br/>• Advertising Services"]

    %% Stage 2
    S2[Stage 2 Intermediate Demand<br/>Early Processing]
    S2_Examples["• Basic Manufacturing<br/>• Primary Processing<br/>• Foundational Services"]

    %% Stage 3
    S3[Stage 3 Intermediate Demand<br/>Advanced Processing]
    S3_Examples["• Component Manufacturing<br/>• Specialized Services<br/>• Intermediate Goods"]

    %% Stage 4 - Closest to Final Demand
    S4[Stage 4 Intermediate Demand<br/>Near-Final Processing]
    S4_Examples["• Final Assembly Inputs<br/>• Pre-Consumer Services<br/>• Distribution Services"]

    %% Final Demand
    FD[Final Demand]
    FD_Examples["• Personal Consumption<br/>• Capital Investment<br/>• Government Purchases<br/>• Exports"]

    %% Consumer Price Indexes
    PCE[PCE Price Index<br/>Fed's Preferred Inflation Measure]
    CorePCE[Core PCE Price Index<br/>Excludes Food & Energy]
    CPI[Consumer Price Index<br/>Urban Consumers]

    %% Flow connections with transmission strength
    S1 -->|"Weak<br/>Transmission"| S2
    S2 -->|"Intermediate<br/>Transmission"| S3
    S3 -->|"Intermediate<br/>Transmission"| S4
    S4 -->|"Direct<br/>Transmission<br/> STRONGEST"| FD

    %% Final demand to consumer prices
    FD -->|"Direct<br/>Transmission"| PCE
    FD -->|"Intermediate<br/>Transmission"| CorePCE
    FD -->|"Intermediate<br/>Transmission"| CPI

    %% Side connections for examples
    S1 -.-> S1_Examples
    S2 -.-> S2_Examples
    S3 -.-> S3_Examples
    S4 -.-> S4_Examples
    FD -.-> FD_Examples

    %% Styling
    classDef stageBox fill:#82cfff,stroke:#0f62fe,stroke-width:2px,color:#161616
    classDef finalBox fill:#e8d5ff,stroke:#673AB7,stroke-width:2px,color:#161616
    classDef consumerBox fill:#c7f0d0,stroke:#42be65,stroke-width:2px,color:#161616
    classDef exampleBox fill:#fffaf3,stroke:#FF6F00,stroke-width:1px,stroke-dasharray: 5 5,color:#161616

    class S1,S2,S3,S4 stageBox
    class FD finalBox
    class PCE,CorePCE,CPI consumerBox
    class S1_Examples,S2_Examples,S3_Examples,S4_Examples,FD_Examples exampleBox

    %% Add title and notes
    %% subgraph Legend [" "]
    %%     L1["🔄 Price transmission flows from raw materials to consumers"]
    %%     L1 --- L2["📊 Stage 4 has strongest transmission to consumer prices"]
    %%     L2 --- L3["⚠️ Stage 1 has weakest transmission (least useful)"]
    %%     L3 --- L4["★ Best predictor for future Core PCE inflation"]
    %% end

    classDef legendBox fill:#fafafa,stroke:#757575,stroke-width:1px
    class Legend,L1,L2,L3,L4 legendBox
Lewis-Mertens-Stock Index
Code
wei=get_data(f, "WEI"; observation_start="2024-08-09", observation_end="2025-08-10", ).dataplot(wei.date, wei.value; label="", xlabel="Week Ending", ylabel="Annualized Growth Rate", title="High-Frequency Growth Has Slowed in Recent Weeks", linewidth=2,)
The Lewis-Mertens-Stock Index Attempts To Calculate The Annualized Rate Of Economic Growth Of The Trailing Week’s Economic Data. According to Lewis, Mertens, and Stock, “The WEI is an index of real economic activity using timely and relevant high-frequency data. It represents the common component of ten different daily and weekly series covering consumer behavior, the labor market, and production. The WEI is scaled to the four-quarter GDP growth rate; for example, if the WEI reads -2 percent and the current level of the WEI persists for an entire quarter, one would expect, on average, GDP that quarter to be 2 percent lower than a year previously. The WEI is a composite of 10 weekly economic indicators: Redbook same-store sales, Rasmussen Consumer Index, new claims for unemployment insurance, continued claims for unemployment insurance, adjusted income/employment tax withholdings (from Booth Financial Consulting), railroad traffic originated (from the Association of American Railroads), the American Staffing Association Staffing Index, steel production, wholesale sales of gasoline, diesel, and jet fuel, and weekly average US electricity load (with remaining data supplied by Haver Analytics). All series are represented as year-over-year percentage changes. These series are combined into a single index of weekly economic activity.” [Lewis, Mertens, and Stock, accessed 2025-08-14]
Economic Degradation
WSJ Headline: The Era Of Big Praises For Low-Paid Workers Is Over [Wall Street Journal, 2025-08-11]
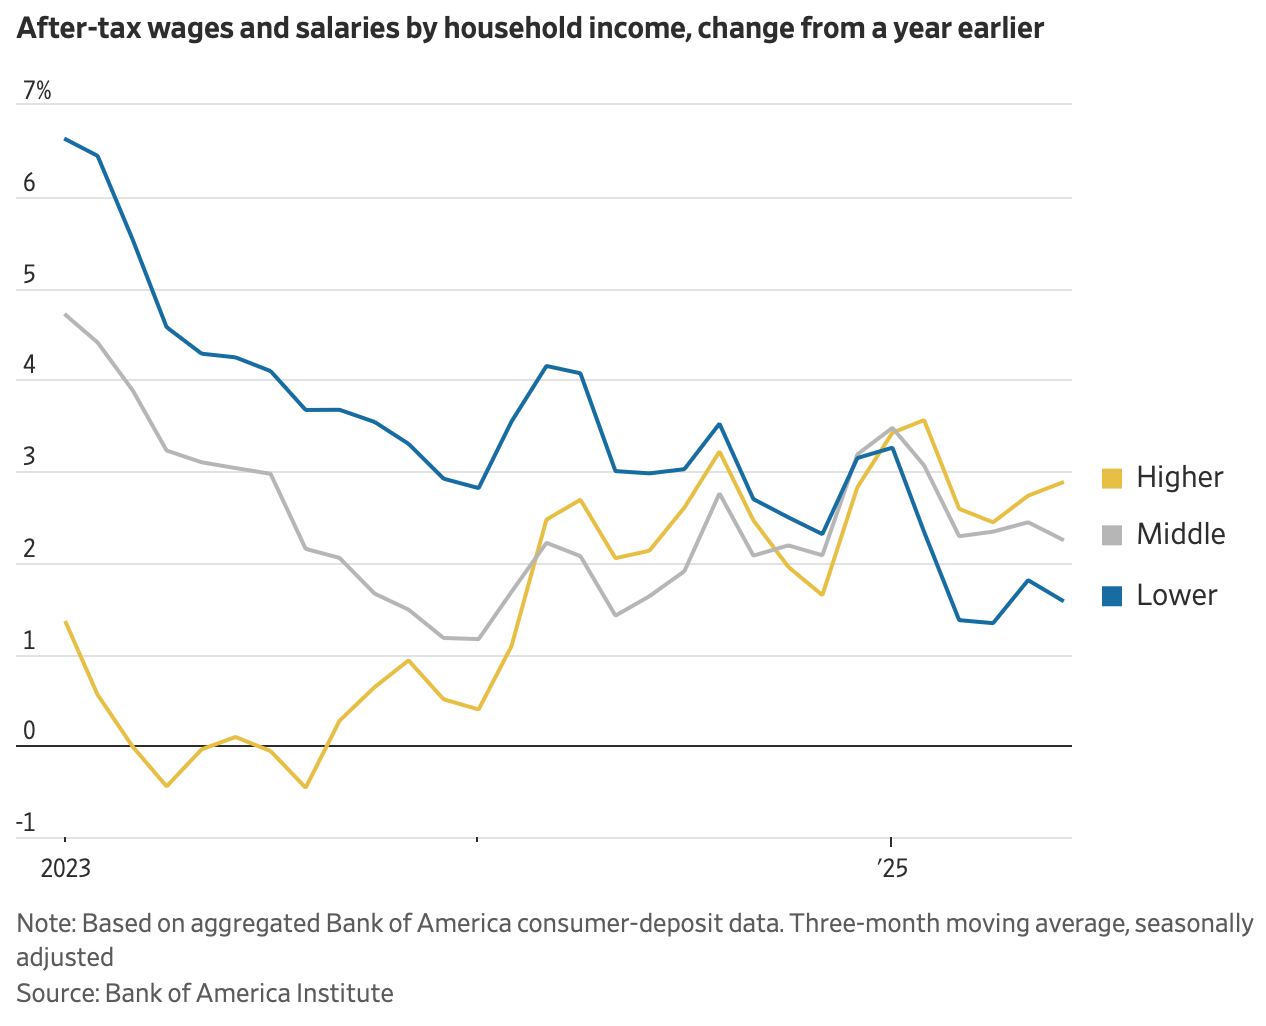
In Recent Months, “Wage Growth For Low-Income Workers Looks TO Have Significantly Deteriorated.” According to the Wall Street Journal, “Wage growth for low-income workers looks to have significantly deteriorated in recent months, while wage growth for their higher-income counterparts has held up much better. It is a shift that could matter not just for low-paid workers, but the overall economy.” [Wall Street Journal, 2025-08-11]
Bank Of America: In A Reversal, Lower-Income Households Income Has Fallen Below That Of Higher And Middle Income Households Since Trump’s Election. According to the Wall Street Journal, “A Bank of America Institute analysis of BofA customer data tells a similar story. It shows that after-tax wages and salaries for households at the bottom third by income were up 1.6% this June from a year earlier, versus 2.9% for households in the top third. As recently as December, the BofA data showed wage growth for lower-income households was outpacing high-income wage growth.” [Wall Street Journal, 2025-08-11]
Corporate Uncertainty
Amid Trump-Driven Uncertainty, Companies Have Put A Record Amount Of Money Into Share Buybacks. According to the Wall Street Journal, “American companies are repurchasing their shares at a record pace, boosting their balance sheets and fueling the U.S. stock rally. U.S. companies have announced $983.6 billion worth of stock buybacks so far this year, the best start to a year on record, according to Birinyi Associates data going back to 1982. They are projected to purchase more than $1.1 trillion worth overall in 2025, which would mark an all-time high. The biggest repurchasers include tech giants Apple and Google parent Alphabet. Big banks such as JPMorgan Chase, Bank of America and Morgan Stanley also are leading the charge. Strong earnings growth and tax cuts have helped fill corporate coffers, while powering stocks out of their tariff-driven April rout and lifting the S&P 500 and Nasdaq composite to fresh records. At the same time, the confusion around trade has stalled many businesses” investment plans, making buybacks a more appealing use of incoming cash.” [Wall Street Journal, 2025-08-11]
Despite “Stretched Valuations,” Companies Have Found Buybacks More Appealing Than Longer-Term Commitments. According to the Wall Street Journal, “But the practice is controversial in some quarters, with skeptics contending that repurchases serve to prop up the market at a time of already stretched valuations. Some analysts worry that the preference for buybacks over longer-term commitments such as investing in factories or offering dividends suggests President Trump’s trade war stands to weigh on growth over time.” [Wall Street Journal, 2025-08-11]
Corruption
State Capitalism
WSJ: Trump’s Behavior Has Approached That Of The Chinese Communist Party, Embracing “State Capitalism.” According to the Wall Street Journal, “A generation ago conventional wisdom held that as China liberalized, its economy would come to resemble America”s. Instead, capitalism in America is starting to look like China. Recent examples include President Trump’s demand that Intel’s chief executive resign; the 15% of certain chip sales to China that Nvidia and Advanced Micro Devices will share with Washington; the ‘golden share’ Washington will get in U.S. Steel as a condition of Nippon Steel’s takeover; and the $1.5 trillion of promised investment from trading partners Trump plans to personally direct. This isn’t socialism, in which the state owns the means of production. It is more like state capitalism, a hybrid between socialism and capitalism in which the state guides the decisions of nominally private enterprises. China calls its hybrid ‘socialism with Chinese characteristics.’ The U.S. hasn’t gone as far as China or even milder practitioners of state capitalism such as Russia, Brazil and, at times, France. So call this variant ‘state capitalism with American characteristics.’ It is still a sea change from the free market ethos the U.S. once embodied.” [Wall Street Journal, 2025-08-11]
PancakeSwap
Since The 2024 Election, The Trump Family’s Crypto Activity Has, With The Help Of PancakeSwap, A Platform Administered By The Pardon-Seeking Binance, Profited By $4.5 Billion. According to the Wall Street Journal, “The Trump family’s crypto venture has generated more wealth since the election—some $4.5 billion—than any other part of the president’s business empire. A major reason for the success is a partnership with an under-the-radar trading platform quietly administered by Binance, the world’s largest crypto exchange, whose founder is seeking a pardon from President Trump, according to people familiar with the matter. The online trading platform, PancakeSwap, serves as an incubator of sorts, drumming up interest among traders to use coins issued by the Trump family’s main crypto company, World Liberty Financial. The more World Liberty’s flagship coin, USD1, is used, the greater demand to increase its circulation, and the greater the profit for World Liberty and its owners, including the Trump family. PancakeSwap is an online marketplace for cryptocurrencies. It connects users who trade USD1 with newly created currencies such as Torch of Liberty and Eagles Landing. These patriotic-sounding coins, according to their websites, were launched this year with the main purpose of helping increase the use of USD1. Traders, mostly writing in Chinese, gather in groups on the Telegram messaging app to talk about competing for rewards paid out to top users of USD1 and advertised by PancakeSwap.” [Wall Street Journal, 2025-08-12]
Since PancakeSwap Started Using USD1, It Has Reached 90 Percent Of Global Volume In The Trump-Backed Stablecoin. According to the Wall Street Journal, “Crypto companies release thousands of new coins every year. Most never catch on. To attract a following among traders, new coins need to show big trading volume. That is where PancakeSwap stepped in. PancakeSwap doesn’t disclose its ownership and says online that it is run by a team of anonymous ‘chefs’ with a ‘penchant for breakfast foods.’ It compares trading cryptocurrencies to ‘flipping pancakes.’ According to former Binance employees, Binance staff created PancakeSwap in-house in 2020 because the exchange wanted to establish a foothold in crypto’s so-called decentralized finance craze. The platform has remained under Binance’s supervision, the former employees said. PancakeSwap’s trading platform is built on Binance’s blockchain network, a type of software ecosystem in which developers create new programs. Starting in late May, USD1 trading exploded on PancakeSwap, rocketing from a few tens of millions of dollars a day to regularly over $1 billion. Over 90% of USD1 trades have taken place on PancakeSwap, according to data from the platform and data tracker CoinMarketCap. World Liberty touted the soaring customer demand for USD1, saying in June that its trading volumes had briefly outstripped another larger stablecoin”s.” [Wall Street Journal, 2025-08-12]
Binance, By Continuing To Hold Its $2 Billion In USD1, Ensures That The Trump-Backed Coin Continued To Earn Roughly $80 Million Per Year. According to the Wall Street Journal, “World Liberty unveiled USD1 in March, saying the token would assist Trump’s mission to protect the status of the U.S. dollar as the world’s reserve currency. Binance played a key role from an early stage. USD1 got its first big break when Binance accepted a $2 billion investment from an outside investor paid in the World Liberty coin. The deal caused the amount of the cryptocurrency in circulation to erupt 15-fold and overnight become one of the world’s largest. USD1 is what is known as a stablecoin, a privately invented digital currency that is backed 1:1 with U.S. dollars. World Liberty invests the money backing the coin in government bonds and money-market funds, without paying interest to users of the coin. With more than $2 billion of USD1 in circulation, it can earn around $80 million a year based on current interest rates. Binance has been holding the $2 billion in USD1 on its platform, according to blockchain data and a person familiar with the matter. By not cashing in the stablecoin, this ensures that World Liberty continues to earn money from investing the dollars that back them.” [Wall Street Journal, 2025-08-12]